Table of Contents
Get source code for this RMarkdown script here.
This Python tutorial is also on Medium, Towards Data Science. Click here if you’re looking for the tutorial for the R version of pivot_table (also the dcast function in R).
The opposite of pivot_table is melt, and you can find the tutorial for melt (wide to long) here.
If you’re an R user, the melt function in R works just like Python’s melt.
Consider being a patron and supporting my work?
Donate and become a patron: If you find value in what I do and have learned something from my site, please consider becoming a patron. It takes me many hours to research, learn, and put together tutorials. Your support really matters.
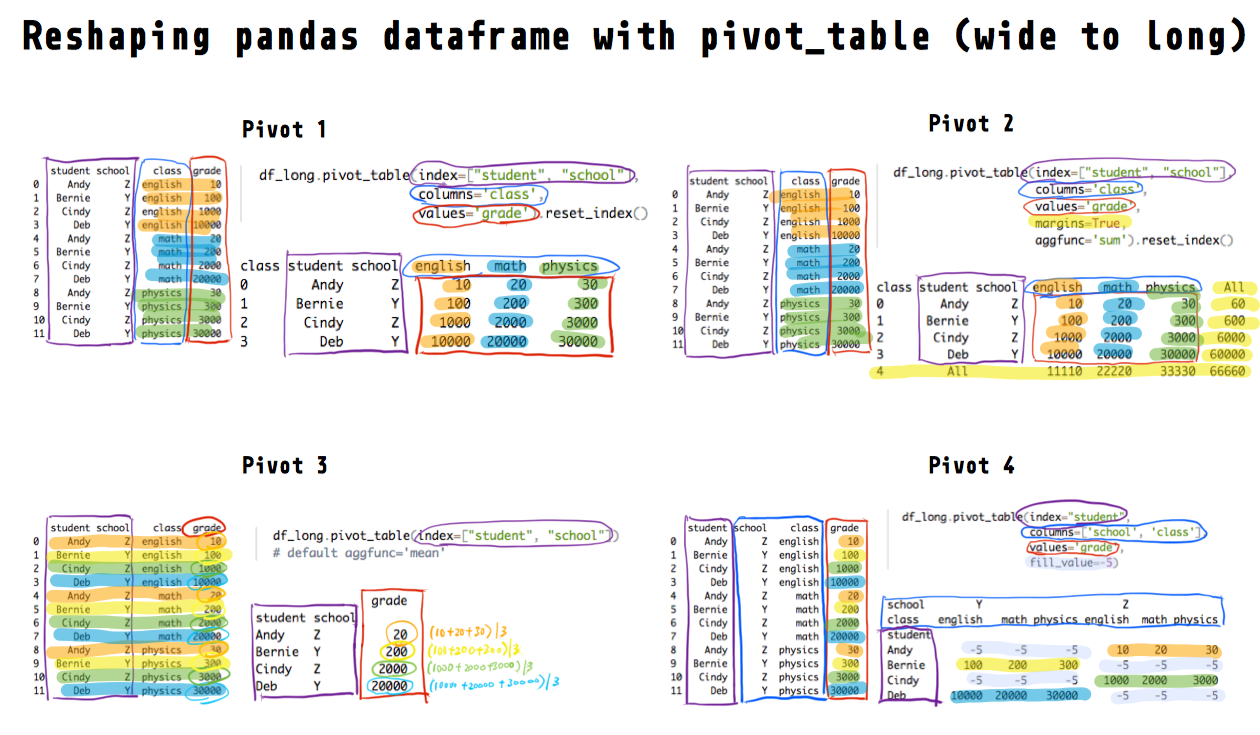
How does the pandas pivot_table() method reshape dataframes? How do you reshape a dataframe from long to wide form? This tutorial will walk you through reshaping dataframes using pd.pivot_table() or the pivot_table method associated with pandas dataframes.
Also, you might want to check out the official pandas documentation and my numpy reshape tutorial.
Let’s load the reticulate library in R so we can run Python in RStudio. I’ll then load my conda python environment. I highly recommend you try the code in Python while you read this article. Try running this tutorial on my shared DeepNote notebook (you can only run but not edit this notebook).
library(reticulate)
# load conda python environment
use_condaenv(condaenv = "python376", conda = "/opt/anaconda3/bin/conda")
import pandas as pdLong data
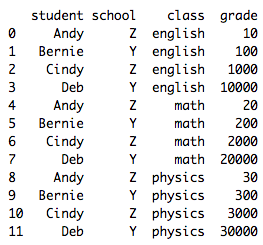
It’s easiest to understand what a long dataframe is or looks like if we look at one and compare it with a wide dataframe.
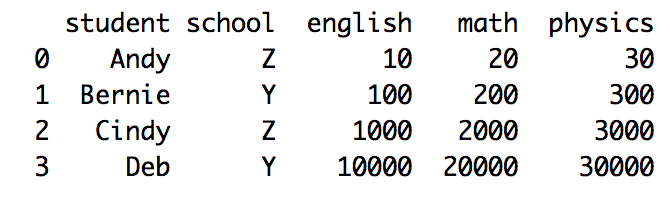
And below is the corresponding dataframe (with the same information) but in the wide form:
Before we begin our pd.pivot_table tutorial, let’s recreate the long dataframe above in Python with pd.DataFrame.
df_long = pd.DataFrame({
        "student":
            ["Andy", "Bernie", "Cindy", "Deb",
             "Andy", "Bernie", "Cindy", "Deb",
             "Andy", "Bernie", "Cindy", "Deb"],
        "school":
            ["Z", "Y", "Z", "Y",
             "Z", "Y", "Z", "Y",
             "Z", "Y", "Z", "Y"],
        "class":
            ["english", "english", "english", "english",
             "math", "math", "math", "math",
             "physics", "physics", "physics", "physics"],
        "grade":
            [10, 100, 1000, 10000,
             20, 200, 2000, 20000,
             30, 300, 3000, 30000]

})
df_long
   student school    class  grade
0     Andy      Z  english     10
1   Bernie      Y  english    100
2    Cindy      Z  english   1000
3      Deb      Y  english  10000
4     Andy      Z     math     20
5   Bernie      Y     math    200
6    Cindy      Z     math   2000
7      Deb      Y     math  20000
8     Andy      Z  physics     30
9   Bernie      Y  physics    300
10   Cindy      Z  physics   3000
11     Deb      Y  physics  30000
Long to wide with pivot_table
Common terms for this transformation are pivot, spread, dcast. See pd.pivot_table() documentation here.
We’ll use the pivot_table method because it’s very flexible relative to the pivot method (which I won’t explain here since pivot_table does everything pivot can do).
Pivot example 1
We often want to keep the identifier columns as they are (index=["student", "school"]) but pivot or “split” a column’s values (values='grade') based on another column (columns='class'). Compare the original and pivoted dataframes below and you’ll understand what that means.
Each unique value in the class column will be a new column (english, math, physics) in the pivoted/wide dataframe. We can also provide a list to the columns parameter.
df_long.pivot_table(index=["student", "school"],
                    columns='class',
                    values='grade')
class           english   math  physics
student school
Andy    Z            10     20       30
Bernie  Y           100    200      300
Cindy   Z          1000   2000     3000
Deb     Y         10000  20000    30000
To get rid of the multi-index, use .reset_index()
df_long.pivot_table(index=["student", "school"],
                    columns='class',
                    values='grade').reset_index()
class student school  english   math  physics
0        Andy      Z       10     20       30
1      Bernie      Y      100    200      300
2       Cindy      Z     1000   2000     3000
3         Deb      Y    10000  20000    30000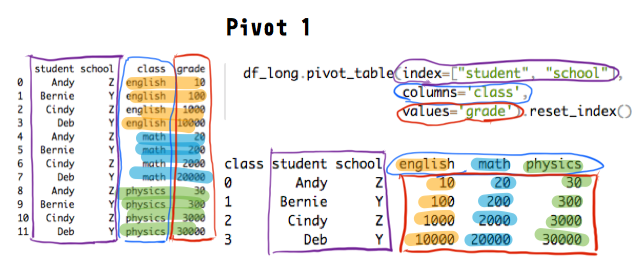
Pivot example 2
You can also aggregate each resulting row and column by specifying margins=True (default False).
The example below aggregates by computing the sum via aggfunc='sum' (default 'mean') and there are many other aggregation functions you can use (e.g., 'median', 'sum', 'max'). You can also specify multiple functions as a list (e.g., aggfunc=['mean', 'sum'])
df_long.pivot_table(index=["student", "school"],
                    columns='class',
                    values='grade',
                    margins=True,
                    aggfunc='sum').reset_index()
class student school  english   math  physics    All
0        Andy      Z       10     20       30     60
1      Bernie      Y      100    200      300    600
2       Cindy      Z     1000   2000     3000   6000
3         Deb      Y    10000  20000    30000  60000
4         All           11110  22220    33330  66660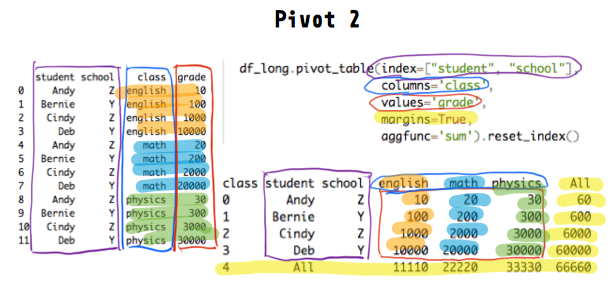
Pivot example 3
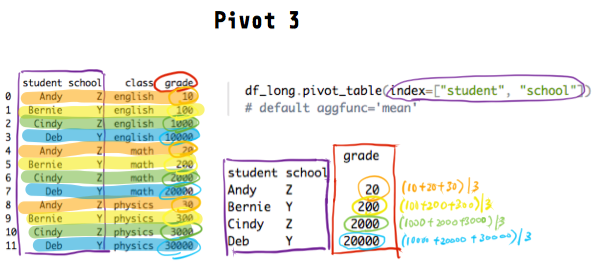
If we don’t specify any columns via columns, all remaining non-identifier numeric columns (only grade in this dataframe) will be pivoted (long to wide).
df_long.pivot_table(index=["student", "school"])
# default aggfunc='mean'
                grade
student school
Andy    Z          20
Bernie  Y         200
Cindy   Z        2000
Deb     Y       20000
In the original long data, each student has four grades (english, math, physics), yet in the pivot_table example above, each student only has one grade after pivoting.
Why and how does it work? If you remember from the example above, the default is aggfunc='mean'. Thus, what the function did was it grouped the data by student and school (via index=["student", "school"]), and computed the mean value for each group.
If you use the groupby method associated with the pandas dataframe, you will get the same result as above.
df_long.groupby(['student', 'school']).mean()
                grade
student school
Andy    Z          20
Bernie  Y         200
Cindy   Z        2000
Deb     Y       20000
If you change the default aggregation function (e.g., aggfunc='max'), you’ll get different results. The examples below show you how to specify different aggregation functions and also show you how groupby can be used to perform the same pivot.
Note that you’ll also see the class that is associated with each ‘max’ and ‘first’ value.
df_long.pivot_table(index=["student", "school"],
                    aggfunc=['max', 'first'])
                    max           first
                  class  grade    class  grade
student school
Andy    Z       physics     30  english     10
Bernie  Y       physics    300  english    100
Cindy   Z       physics   3000  english   1000
Deb     Y       physics  30000  english  10000
df_long.groupby(["student", "school"]).agg(['max', 'first'])
                  class           grade
                    max    first    max  first
student school
Andy    Z       physics  english     30     10
Bernie  Y       physics  english    300    100
Cindy   Z       physics  english   3000   1000
Deb     Y       physics  english  30000  10000
Pivot example 4
The final example shows you what happens when you pivot multiple columns (columns=['school', 'class']) and you can deal with missing values after pivoting.
Here we’re saying, for each student (index="student"), split their grades (values=grade) into separate columns, based on their school and class (columns=['school', 'class']).
df_long.pivot_table(index="student",
                    columns=['school', 'class'],
                    values='grade')
school         Y                         Z
class    english     math  physics english    math physics
student
Andy         NaN      NaN      NaN    10.0    20.0    30.0
Bernie     100.0    200.0    300.0     NaN     NaN     NaN
Cindy        NaN      NaN      NaN  1000.0  2000.0  3000.0
Deb      10000.0  20000.0  30000.0     NaN     NaN     NaN
The NaN values are expected because each student belongs to only one school (Y or Z). For example, Andy is in school Z and therefore doesn’t have grades in the Y columns.
We can replace the NaN values with another value (-5 in the example below).
df_long.pivot_table(index="student",
                    columns=['school', 'class'],
                    values='grade',
                    fill_value=-5)
school        Y                      Z
class   english   math physics english  math physics
student
Andy         -5     -5      -5      10    20      30
Bernie      100    200     300      -5    -5      -5
Cindy        -5     -5      -5    1000  2000    3000
Deb       10000  20000   30000      -5    -5      -5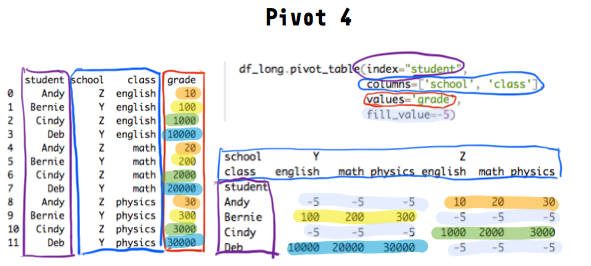
Resources
- Pandas official reshaping documentation
- Excellent stackoverflow responses
- Chris Albon’s pivot_table examples
- Practical Business Python’s pivot_table tutorial
Support my work
I hope now you have a better understanding of how pd.pivot_table reshapes dataframes. If you find this post useful, check out my other articles and follow me on Medium.
If you’ve enjoyed my article, support my work and become a patron here!