Table of Contents
Get source code for this RMarkdown script here.
Consider being a patron and supporting my work?
Donate and become a patron: If you find value in what I do and have learned something from my site, please consider becoming a patron. It takes me many hours to research, learn, and put together tutorials. Your support really matters.
Problems with z-score approach
Consider the small set of numbers assigned to variable scores below. Just by eyeballing the data, it looks like there’s one outlier: 1000
scores <- c(-3, 1, 3, 3, 6, 8, 10, 10, 1000)
mean(scores) # mean
[1] 115.3333
sd(scores) # sd
[1] 331.7778
boxplot(scores) # 1000 looks like an extreme outlier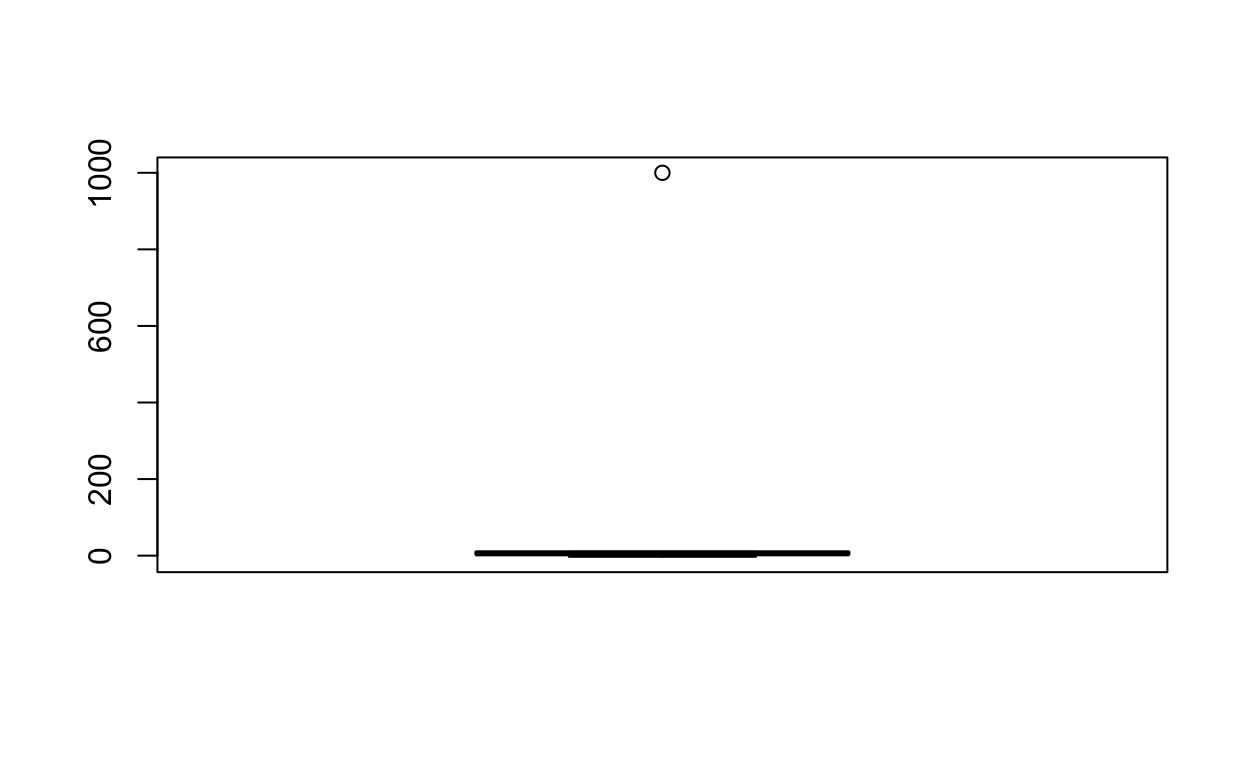
What are the standard or z-scores for each value?
\[z_{i} = \frac{x_{i}-\overline{x}}{\sigma}\] where \(z_{i}\) is the z-score for a particular score, \(x_{i}\) is a particular score, \(\overline{x}\) is the mean of all scores, and \(\sigma\) is the standard deviation of all scores.
The equation above expressed in code:
scores_z <- (scores - mean(scores)) / sd(scores)
scores_z  # 1000 has a z-score < 3
[1] -0.3566644 -0.3446082 -0.3385800 -0.3385800 -0.3295378 -0.3235097
[7] -0.3174816 -0.3174816  2.6664433
The z-score of the largest value is 2.6664433, which is relatively small, considering researchers tend to consider scores as outliers only if they have z-scores 3 or larger.
Outliers bias the mean and standard deviation
So we seem to have a problem here: By eyeballing the scores, we intuitively know that 1000 should be an outlier, but the z-score outlier detection approach suggests 1000 isn’t an outlierand we shouldn’t remove it Of course, you could set your exclusion criterion to “scores with z-scores 2.5 (rather than 3.0) or greater will be considered outliers”. But changing the criterion arbitrarily doesn’t address the main problem:
- extremely negative/positive scores bias the mean and standard deviation, affecting the resulting z-score
mean(scores) # original mean
[1] 115.3333
mean(scores[1:8]) # mean after excluding extreme value
[1] 4.75
sd(scores) # original sd
[1] 331.7778
sd(scores[1:8]) # sd after excluding extreme value
[1] 4.590363Function from hausekeep package to compute z-scores
To make it easier to compute z-scores, detect outliers, and remove extreme values (based on your cut-off, 1.96, 2.5 or 3 or whatever), I’ve created the function outliersZ(), which is available in my hausekeep package. When you run the function, it tells you how many outliers were detected and what they’ve been replaced by (default replaces them with NA).
library(hausekeep)
outliersZ(scores, zCutOff = 3.0) # replace values with z-scores greater than ± 3
[1] -3 1 3 3 6 8 10 10 1000
outliersZ(scores, showZValues = TRUE) # show z values (default = FALSE)
[1] -0.38 -0.37 -0.36 -0.36 -0.35 -0.34 -0.34 -0.34 2.83
outliersZ(scores, zCutOff = 0.35) # note that default zCutOff is 1.96
[1] NA NA NA NA 6 8 10 10 NA
outliersZ(scores, replaceOutliersWith = -9999) # replace outlier values with -9999
[1] -3 1 3 3 6 8 10 10 -9999For more information, type ?outliersZ in your console. If you want to see how the outliersZ() function is defined, just type outliersZ in your console and you’ll see the source code.
Robust solution: median absolute deviation
Instead of using z-scores to detect outliers (which is problematic for various reasons shown above), we can instead use a simple and robust alternative that isn’t influenced by extreme outlier values: median absolute deviaion (Leys et al. 2019, 2013). See Wikipedia article on median absolute deviation.
Before we can compute the median absolute deviation, we need the median:
scores_median <- median(scores)
scores_median
[1] 6Next we subtract the median from each value and get the absolute values:
scores_median_absolute_deviation <- abs(scores - scores_median)
scores_median_absolute_deviation
[1] 9 5 3 3 0 2 4 4 994Next we get the median of the median absolute deviations:
median_median_absolute_deviations <- median(scores_median_absolute_deviation)
median_median_absolute_deviations
[1] 4Next, we can compute the median of the absolute deviations (MAD):
scores_mad <- median_median_absolute_deviations * 1.4826
scores_mad
[1] 5.9304This value is conceptually equivalent to standard deviation, but is used when computing median.
And why 1.4826? It’s a constant linked to the assumption of normality of the data, disregarding the abnormality induced by outliers (Rousseeuw and Croux 1993).
You can actually easily compute the median of the absolute deviations by calling the mad() function. I computed it step-by-step above to show you how it’s done. Typically, you can simply call the mad() function and provide your raw values as input.
mad(scores) # save as our manually computed scores_mad
[1] 5.9304Finally, you can compute how much each value deviated:
scores_deviation <- (scores - scores_median) / scores_mad
scores_deviation # note that the value of 1000 has a huge deviation of 167!
[1]  -1.5176042  -0.8431134  -0.5058681  -0.5058681   0.0000000
[6]   0.3372454   0.6744908   0.6744908 167.6109537
Again, the idea is conceptually similar to computed z-scores: for each value, subtract the median from it, and divide by the median of the absolute deviations.
Using this robust approach, the largest value 1000 in our set of values (-3, 1, 3, 3, 6, 8, 10, 10, 1000) has a huge deviation of 167.6109537. Regardless of what criteria you use (2.0, 2.5, 3.0 are all common cut-offs you could use), 1000 is so large that it’ll have to be excluded (consistent with our intuition).
Function from hausekeep package to compute median absolute deviation
To help detect and remove outliers using this robust approach, I’ve created the function outliersMAD(), which is available in my hausekeep package. When you run the function, it tells you how many outliers were detected and what they’ve been replaced by (default replaces them with NA).
library(hausekeep)
outliersMAD(scores, MADCutOff = 3.0) # replace values with deviations greater than ± 3
[1] -3 1 3 3 6 8 10 10 NA
outliersMAD(scores, showMADValues = TRUE) # show deviation (default = FALSE)
[1] -1.52 -0.84 -0.51 -0.51 0.00 0.34 0.67 0.67 167.61
outliersMAD(scores, MADCutOff = 0.6) # note that default cut-off value is 3.0
[1] NA NA 3 3 6 8 NA NA NA
outliersMAD(scores, replaceOutliersWith = -9999) # replace outlier values with -9999
[1] -3 1 3 3 6 8 10 10 -9999For more information, type ?outliersMAD in your console. If you want to see how the outliersMAD() function is defined, just type outliersMAD in your console and you’ll see the source code.
Here’s how you would use the function typically:
scores_outliers_removed <- outliersMAD(scores)
scores_outliers_removed
[1] -3 1 3 3 6 8 10 10 NA
boxplot(scores_outliers_removed)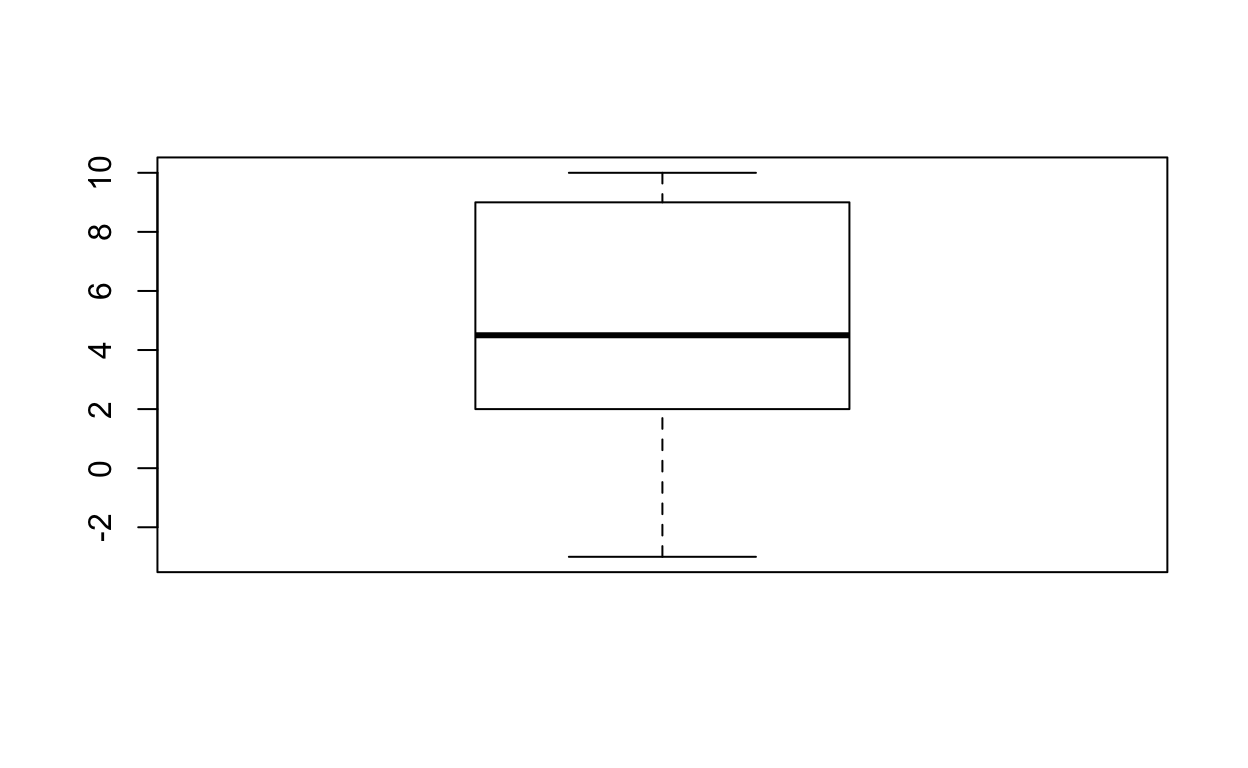
One final example
scores <- c(-5, -2, 4, 8, 55, 100)Use z-score method with 1.96 as cut-off:
scores_removeoutliers_zscore <- outliersZ(scores) # uses 1.96 as default cutoff
scores_removeoutliers_zscore
[1] -5 -2 4 8 55 100Use median absolute deviation method with 3.00 as cut-off:
scores_removeoutliers_mad <- outliersMAD(scores) # uses 3.00 as default cutoff
scores_removeoutliers_mad
[1] -5 -2 4 8 NA NA
par(mfrow = c(1, 3))  # set figure to plot 1 row, 3 columns
boxplot(scores, main = "raw values")
boxplot(scores_removeoutliers_zscore, main = "after z-score outlier removal")
boxplot(scores_removeoutliers_mad, main = "after mad outlier removal")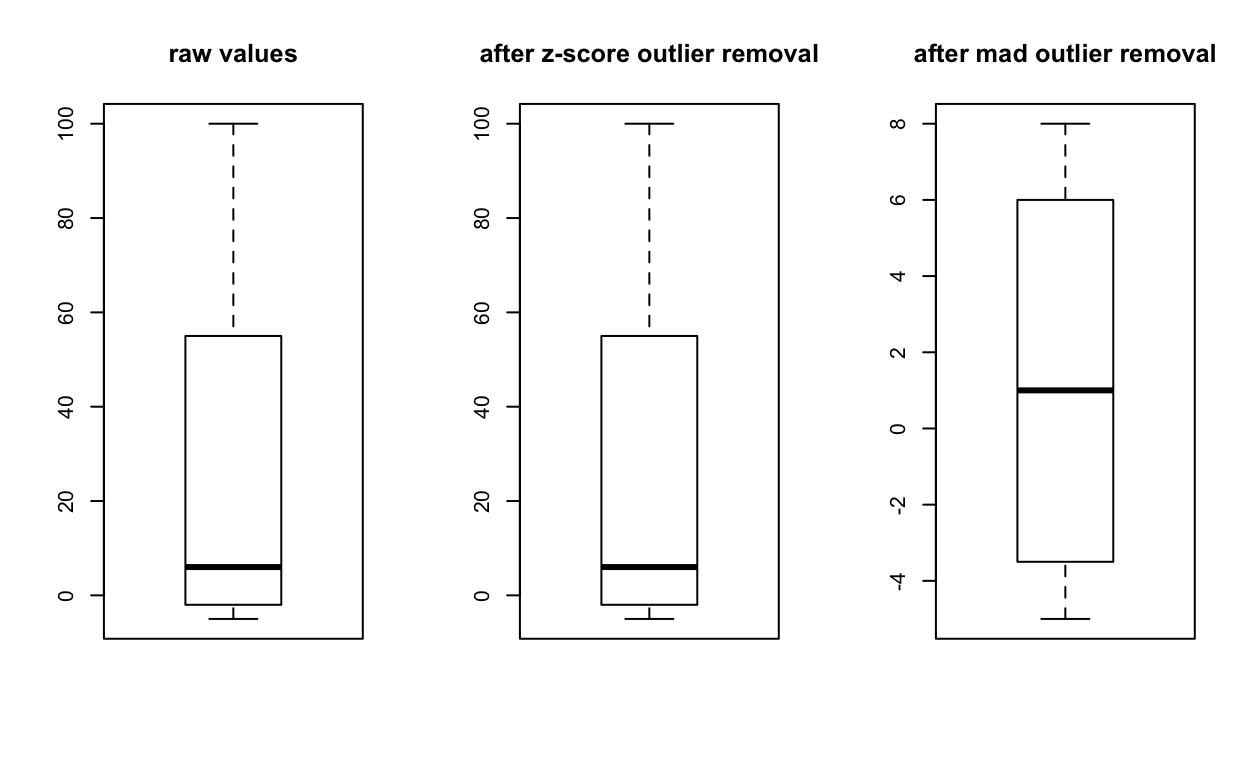
Support my work
Support my work and become a patron here!
Leys, Christophe, Marie Delacre, Youri L. Mora, Daniël Lakens, and Christophe Ley. 2019. “How to Classify, Detect, and Manage Univariate and Multivariate Outliers, with Emphasis on Pre-Registration.” International Review of Social Psychology 32 (1). https://www.rips-irsp.com/articles/10.5334/irsp.289/.
Leys, Christophe, Christophe Ley, Olivier Klein, Philippe Bernard, and Laurent Licata. 2013. “Detecting Outliers: Do Not Use Standard Deviation Around the Mean, Use Absolute Deviation Around the Median.” J. Exp. Soc. Psychol. 49 (4): 764–66. https://www.sciencedirect.com/science/article/pii/S0022103113000668.
Rousseeuw, Peter J., and Christophe Croux. 1993. “Alternatives to the Median Absolute Deviation.” Journal of the American Statistical Association 88 (424): 1273–83.